Radon Saves
Have you ever wondered how computed tomography (CT) scans work? How is it possible that by blasting some "lasers" in the direction of a person's head we can determine with impressive accuracy the intricate geometry and shape of that person's brain? CT scans offer a unique curious mathematical problem and represent, in my opinion, one of the most interesting topics in applied math. This post explores the main mathematical contraption involved - the Radon transform - and how it's used to recover distinct 2D images from aggregated signals.
Tomography is the process of obtaining a visual representation of an object from multiple individual slices from it. It allows for the construction of realistic 3D models whose individual parts have the correct proportions and a high resolution of details. It is used extensively in healthcare and medical applications where it's able to provide invaluable information about the state and shape of the patient's internal organs.
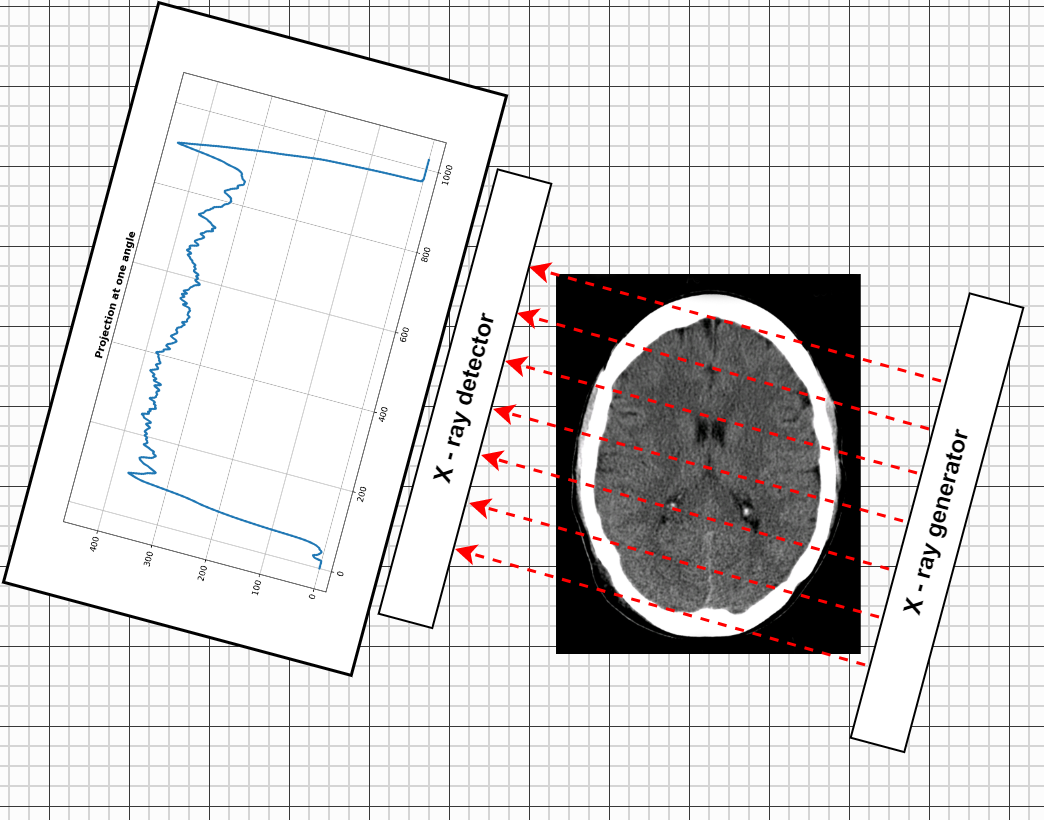
Computed tomography, also called computerized tomography is a technique to do tomography from X-ray slices. The CT scanner consists of the following main components:
- An X-ray tube which converts electricity into X-ray waves. It generates out X-rays into a fairly wide sector and is able to rotate around the object of interest, so that the waves can penetrate it from all directions.
- Multiple X-ray detectors located on the other side of the X-ray generators. They are able to capture the X-rays and measure how attenuated they are. As the X-rays travel they gradually lose their intensity (calculated as the flux of the wave divided by the period), depending on the type of materials they pass through. The X-ray starts with high intensity, travels through the medium and exits with significantly less energy. The detectors measure the difference in energy - how attenuated the ray is. This gives precious information on the density of the material the ray has gone through.
- A gantry which holds the X-ray generator and the detectors. This is typically a moving and rotating frame where the components are attached. By rotating and moving along the height of the object different axial (horizontal), sagittal (longitudinal) or coronal (frontal) slices can be obtained.
The main aspect of theoretical interest is that, for each X-ray, the detector in which it falls, captures the total loss of energy of the ray. Thus from a single measurement we cannot determine where exactly the energy decreased most, how many different types of tissues it went through, and what their densities were. In a sense, what we only see is the sum aggregated from many interactions. The question is how can we reconstruct the inner geometry of the medium from these aggregates - a difficult inverse problem.

For the sake of discussion, suppose the real image of the given slice is given by the function \(f(\textbf{x}) = f(x, y)\), where \(x\) and \(y\) are the spatial coordinates and \(f(x, y)\) is the pixel intensity. A single X-ray travels as a line \(L\) and, simplifying a bit, we observe the integral of the function across that line
This is actually a transform - a higher order object that takes in functions in one domain and maps them to functions in another. Here the input is a function \(f(x, y)\) taking in spatial coordinates \(x\) and \(y\) and the output is a function from the space of all lines to the reals. More concretely this function takes in a concrete line, and returns the integral of \(f(x, y)\) across this line. This transform is called the Radon transform and is central to the topic of computerized tomographies. If \(X \times Y\) is the space of all images and \(L\) the space of all one-dimensional lines, then the signature is:
We can define a line using the equation \(x \cos \phi + y \sin \phi = r\). This corresponds to a line that is perpendicular to the one going through the origin at an incline of \(\phi\), and has a distance to the origin of \(r\). In particular varying the tuple \((\phi, r)\) can produce all lines in the two-dimensional space.
The tuple \((\phi, r)\) also defines a point on the circle with radius \(r\). The \(x\) and \(y\) coordinates of the tangent line at that point can be parameterized as
Here \(z\) is the distance from the tangent point with coordinates \((r\cos \phi, r \sin \phi)\). If \(z\) is 0, we get the tangent point, if \(z\) is not 0 we move along the tangent line.
With these parametrizations we can write the Radon transform as
That is, integrate over all of \(x\) and \(y\), but null out the value if not on the line defined by \((\phi, r)\).
Similarly, this is equivalent to moving along the line directly and integrating only the points on it
So how might we compute the Radon transform for a given image \(f(x, y)\)?
- First, the image has to be padded to a square. This is easily achieved by adding zero rows and columns such that the the non-zero pixels of the actual image stay roughly in the center of the resulting square image.
- Create an array of \(N\) angles to parameterize the different inclinations for the lines - \((\phi_1, \phi_2, ..., \phi_N)\). These should span the range from 0 to 180 degrees.
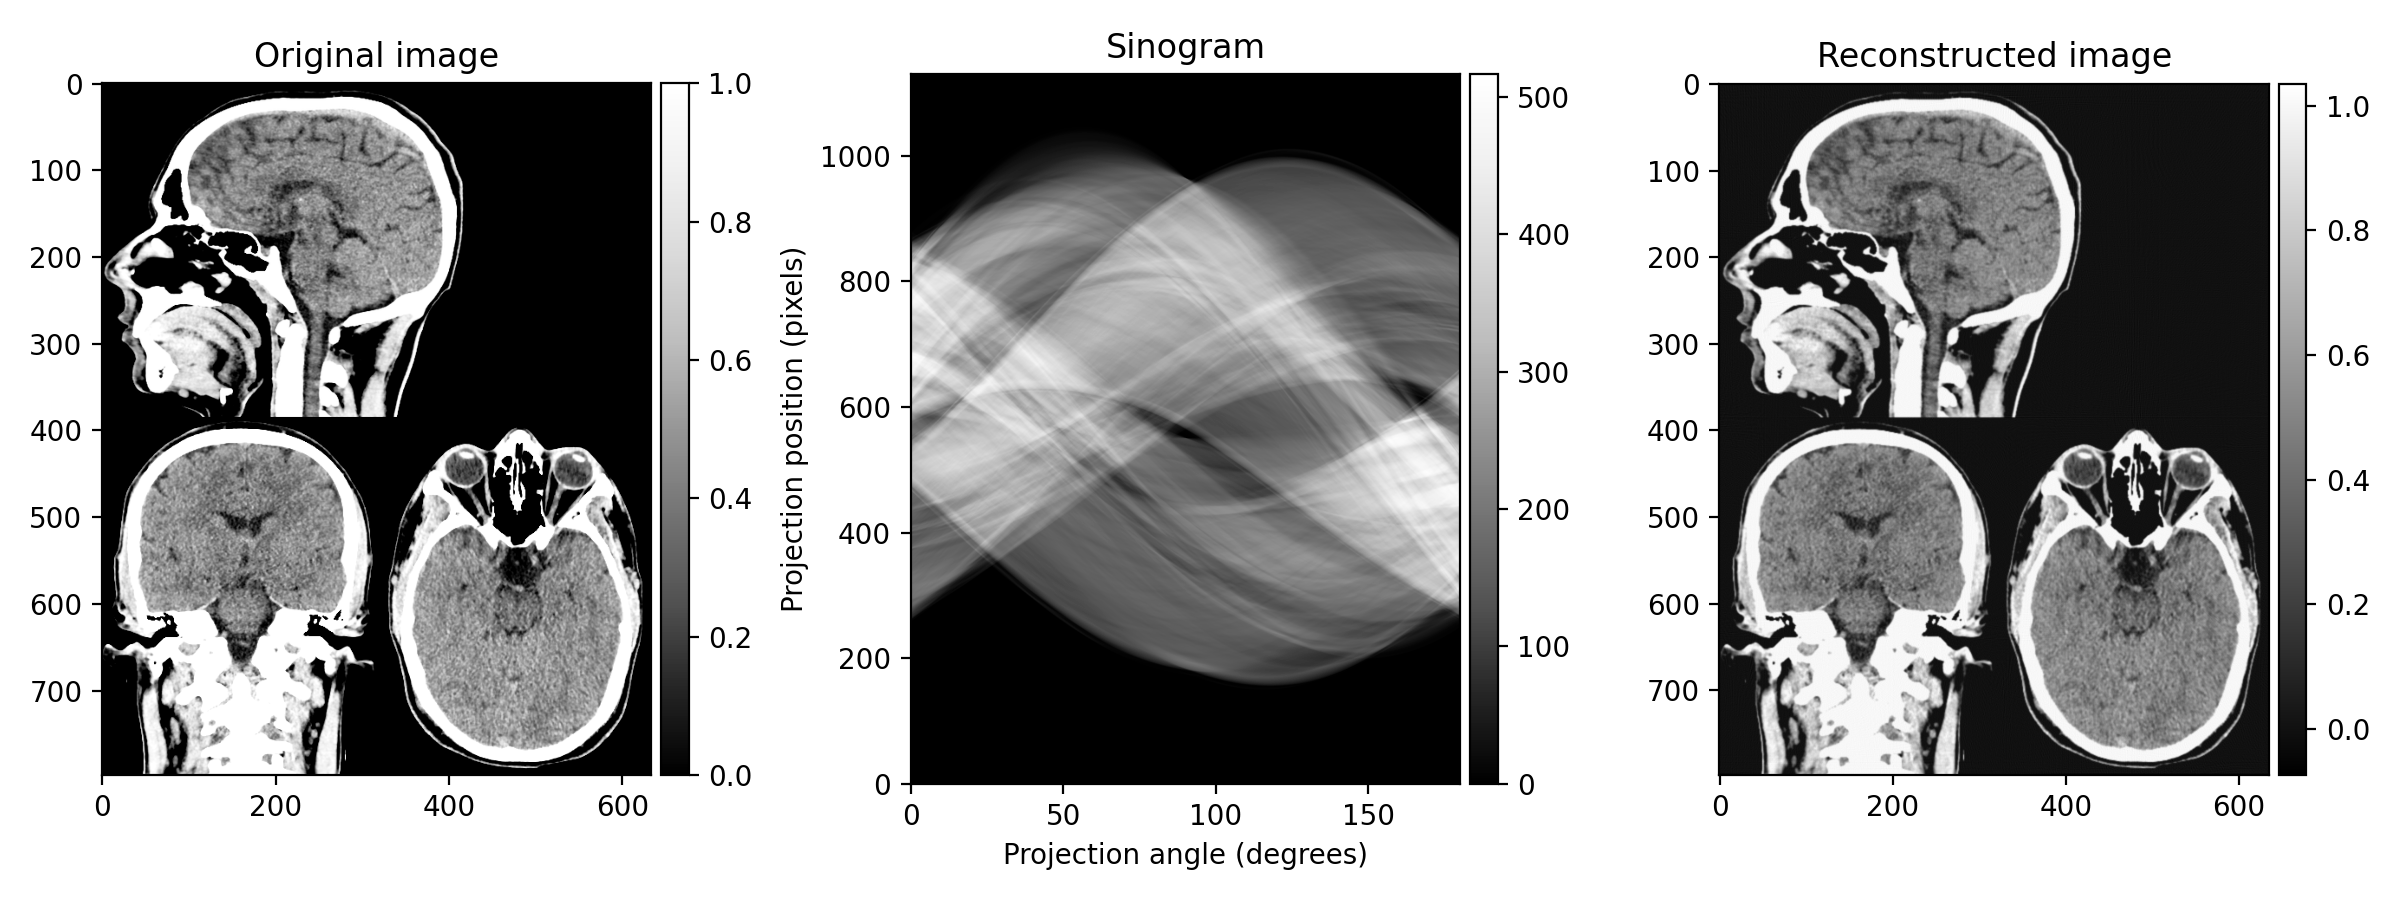
- Initialize a matrix to store the Radon transform results. This should have as many rows as the padded image and as many columns as the angles. This matrix is called a sinogram.
- For each of the angles, rotate the image by that amount. The rotation can be achieved by using a similarity matrix. The translations in the third column ensure that the centre \((c_x, c_y)\) does not change when rotating. Then, sum the pixel intensities across the rows and store the aggregated values in the corresponding column in the sinogram matrix.
At the end we are left with a matrix containing the integrals for the various \((\phi, r)\) lines, where the \(\phi\) angles has been defined manually and the distances \(r\) comes from the pixels along the side of the image.
So this is what the X-ray detectors collect after many rotations. However, What we really care about is the reconstruction of the original image from the sinogram. Since in reality we don't have access to the original image, but only the sinogram, we need to reverse the Radon transform to reconstruct the original image.
To understand how this can be done, first list down the 1D and 2D Fourier transforms:
Now, let's take the Radon transform \(g(\phi, r)\) and apply a one-dimensional Fourier transform on it, along the radius \(r\), holding \(\phi\) fixed. We get
Here \(\xi\) is the frequency variable corresponding to \(r\). The change from the second to the third line comes from the sifting property of the Dirac delta function: when integrating across \(r\), we know that all contributions where \(r \ne x\cos \phi + y \sin \phi\) will be zero and hence we can just evaluate the inner function at \(r = x\cos \phi + y \sin \phi\). In any case, one can recognize that line three is actually the two-dimensional Fourier transform evaluated at \(\xi \cos \phi\) and \(\xi \sin \phi\). And this is not a coincidence, it results from the Fourier slice theorem, stating that the one-dimensional Fourier transform of a single Radon projection is equal to the two-dimensional Fourier transform of the original image evaluated on the line on which the projection was taken.
We have established that by taking one-dimensional convolutions on the Radon projections, we obtain points from the two-dimensional Fourier transform on the original image. The next logical step would be to reconstruct the image with the inverse Fourier transform.
For the two dimensional case the inverse is given by
Let's change to polar coordinates. We set \(u = r \cos \phi\) and \(v = r \sin \phi\). The determinant of the Jacobian of the transformation is then
and the inverse Fourier transform becomes
Here \(r\) and \(\phi\) are placeholder variables and should only showcase the general functional form. By substituting them with \(\xi\), the frequency along the original \(r\) dimension, and \(\phi\), the angle, we can get the inverse 2D transform for our particular problem:
Then, the general strategy of reconstructing the image at point \((x, y)\) is the following: for every line passing through \((x, y)\), each with its own angle \(\phi\), compute the inverse one-dimensional Fourier transform along the frequency dimension \(\xi\) (this would be the inner integral), evaluate it at \((x, y)\), and add the resulting values together (corresponding to the outer integral). In practice adding the values for position \((x, y)\) would require interpolation between them because \(x \cos \phi + y \sin \phi\) would rarely be an exact integer coordinate.
There is a problem however. Since often more lines intersect at the center of the image, the center of our reconstruction will be brighter, and possibly blurrier. This can be fixed, and surprisingly, the solution comes out of the function itself. The term \(|\xi|\) is called a ramp filter because it filters out low frequency signals. It deblurs the image and makes the edges sharper. Here, it is in the frequency domain and is multiplied to the other function, but it can also be applied in the spatial domain as a convolution. In fact, in the spatial domain it corresponds to a wavelet.

This general strategy of applying the projections back in the image is fast and works well in practice. When combined with the filtering step using the ramp (or any other) filter, it's called filtered back projection. When applying the projections back in the spatial domain, they overlap in those regions where \(f(x, y)\) is high and thus interact constructively. Empty regions in the original image do receive some erroneous signal when back projecting but this is more or less fixed by the use of the filter.
References
Images used: here and here
Image Projections and the Radon Transform
Filtered Back Projection